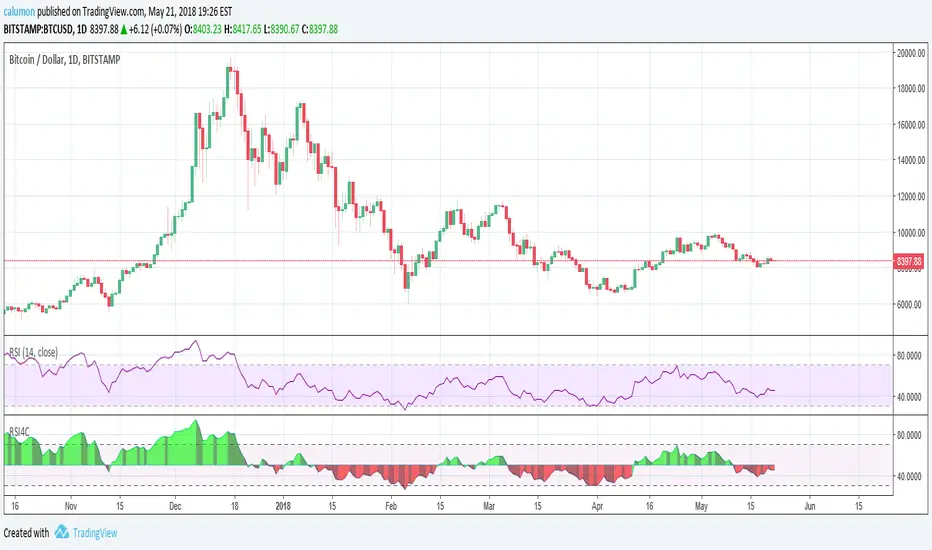
Relative Strength Index 50 LineSuper simple script that just adds a line at the 50 level for the RSI.
스크립트에서 "relative strength"에 대해 찾기
Relative Strength Index - Divergences - LibertusHello all,
To ease everyone's trading experience I made this script which colors RSI overbought and oversold conditions and as a bonus displays bullish or bearish divergences in last 50 candles (by default, you can change it).
Script is open source, part of code is from Trading View examples. If you have suggestions or you already made some improvements, please report in comment.
Happy trading and good luck!


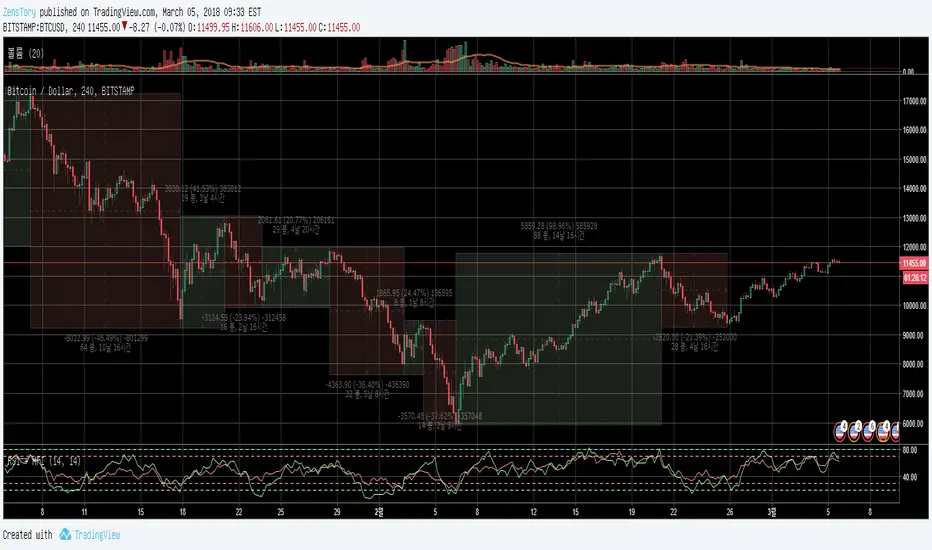
Relative Strength Index (Log/Divs/MTF/EMA)RSI calculated for log scale, with divergences labeled, as well as a 1 hour 55 EMA for signal.
Original log-space RSI by fskrypt.
Divergences taken from JustUncleL, originally from RicardoSantos.

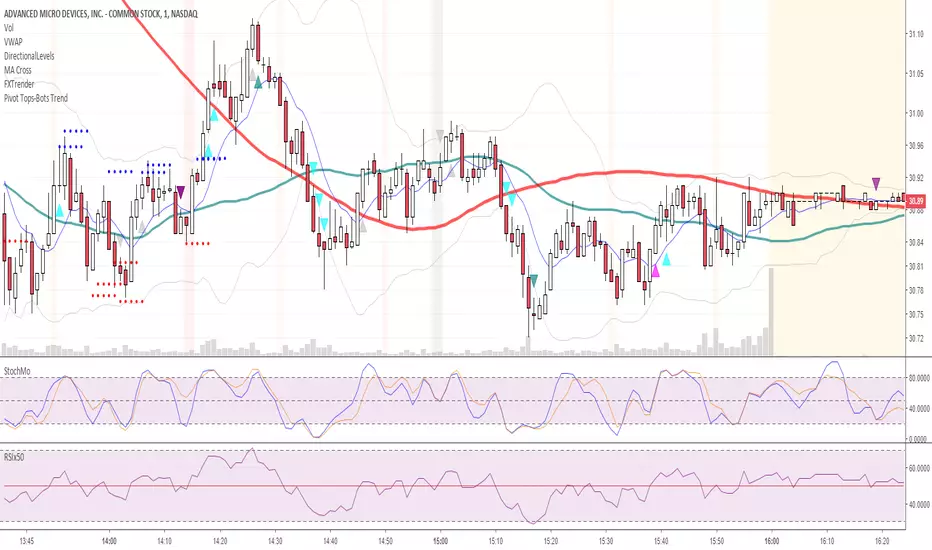
Relative Strength Index + Moving Average + Colors
Standard RSI already stylized
Standard Overbought and Oversold line stylized + middle line
Moving Average, can set length and exponential or simple
MA can be colored based on direction
MA has crosses when yellow, likely soon before a reversal

Relative Strength Index with 4 ColorsThe values used by this indicator are equal to RSI 14. Only changes are made to looks:
If RSI is above 50%, then we are seeing green. Else, we are seeing red.
Another point is that depending on whether the RSI increases or decreases, we get two different color tones.
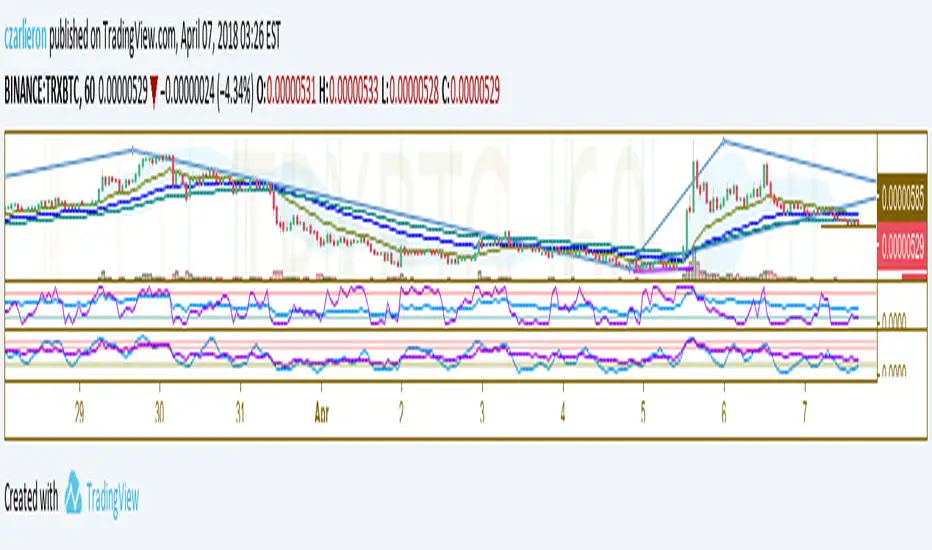
Relative Strength Index + MFI breachI allowed myself to take a piece of code of one of the indicators MFI present on Tradingview for the added to a RSI!
I made this srcipt to avoid cluttering the screen, so we can see the oversold / overbought of the MFI without having any additional indicator

Relative Strength Index with SMADetect reverse point, buy when SMA is comming up and RSI cross up SMA

Relative Strength Index (Color mod)Changed opacity of center band and added green to plot line above 70 and red to plot line below 30.


Relative Strength & sma delta2 RSI with different length at your choise, with 2 sma signal. 4 Plots show the difference between the 2 RSI and 2 Signals , the difference of the 2 RSI and the difference of the Delta of the 2 RSI. So you can have a close view toghether with a bird s eye view. The black line is the middle way.


Relative Strength Index x2Two RSI better then one. Also histogram shows difference of fast and slow RSI.

Adaptive Trend Mapper-ATM [Arjo]Adaptive Trend Mapper (ATM) is a directional pressure indicator designed to visualize how buying and selling commitment evolves during market trends.
Instead of focusing on price direction alone, ATM maps who is exerting stronger pressure —buyers or sellers—and how that pressure expands, weakens, or compresses over time.
Idea
ATM is built around a single concept:
Directional pressure is best understood by weighting trend strength against directional imbalance .
To achieve this, the indicator transforms trend strength into two opposing pressure measures:
Bull Pressure Index
Bear Pressure Index
These indices expand, contract, and converge based on how strongly buyers or sellers are committing, rather than simply tracking momentum or price changes.
How It Works
1. Bull & Bear Pressure Indices
ATM derives two pressure curves by weighting trend strength against directional imbalance:
The Bull Pressure Index increases when upward pressure strengthens.
The Bear Pressure Index increases when downward pressure strengthens.
Both indices operate on a 0–100 scale and are designed to diverge during strong trends and converge during non-directional or compressed phases.
Optional smoothing can be applied to reduce noise and improve readability.
2. Compression / Squeeze Detection
When:
Trend strength weakens,
Bull and Bear pressure converge,
And convergence continues over time,
ATM highlights a compression zone, signaling reduced directional conviction.
These zones often precede directional expansion once pressure rebuilds.
3. Adaptive Trend Context
An adaptive smoothed price curve is displayed on the chart to provide trend context.
Color changes reflect short-term directional shifts, helping align pressure signals with price structure.
This component is contextual only and does not generate signals by itself.
4. Optional Trend Bias Reference
An optional EMA-50 can be enabled to help identify broader directional bias and align pressure behavior with the prevailing trend.
5. Step-Based Visualization
The pressure indices can be optionally step-compressed, improving clarity on fast or noisy charts by reducing minor fluctuations.
How to Use ATM
Rising Bull Pressure → strengthening buyer commitment
Rising Bear Pressure → strengthening seller commitment
Wide separation between indices → strong directional trend
Convergence with compression highlight → range or pre-breakout environment
Notes
ATM uses widely known market concepts such as trend strength, directional imbalance, and adaptive smoothing as conceptual inputs.
All calculations, pressure mapping logic, and compression detection are original implementations developed specifically for this script.
ATM is effective when used to assess participation quality, not as a standalone signal generator.
Disclaimer
This indicator is intended for analysis and educational purposes only.
It does not generate buy or sell signals.
Always apply proper risk management.
Happy Trading.
